Low Volatility, Higher Return

Events may be correlated, because they happen to be that way; but one does not necessarily cause the other, and vice versa.

Like predicting the direction of the stock market based on the results of the Super Bowl games.
For a number of years in the 1990s, if the NFC team won the championship, the stock market would go higher in that year; the market would go down if the AFC team won the prize. It became a guiding principle for stock market pundits.

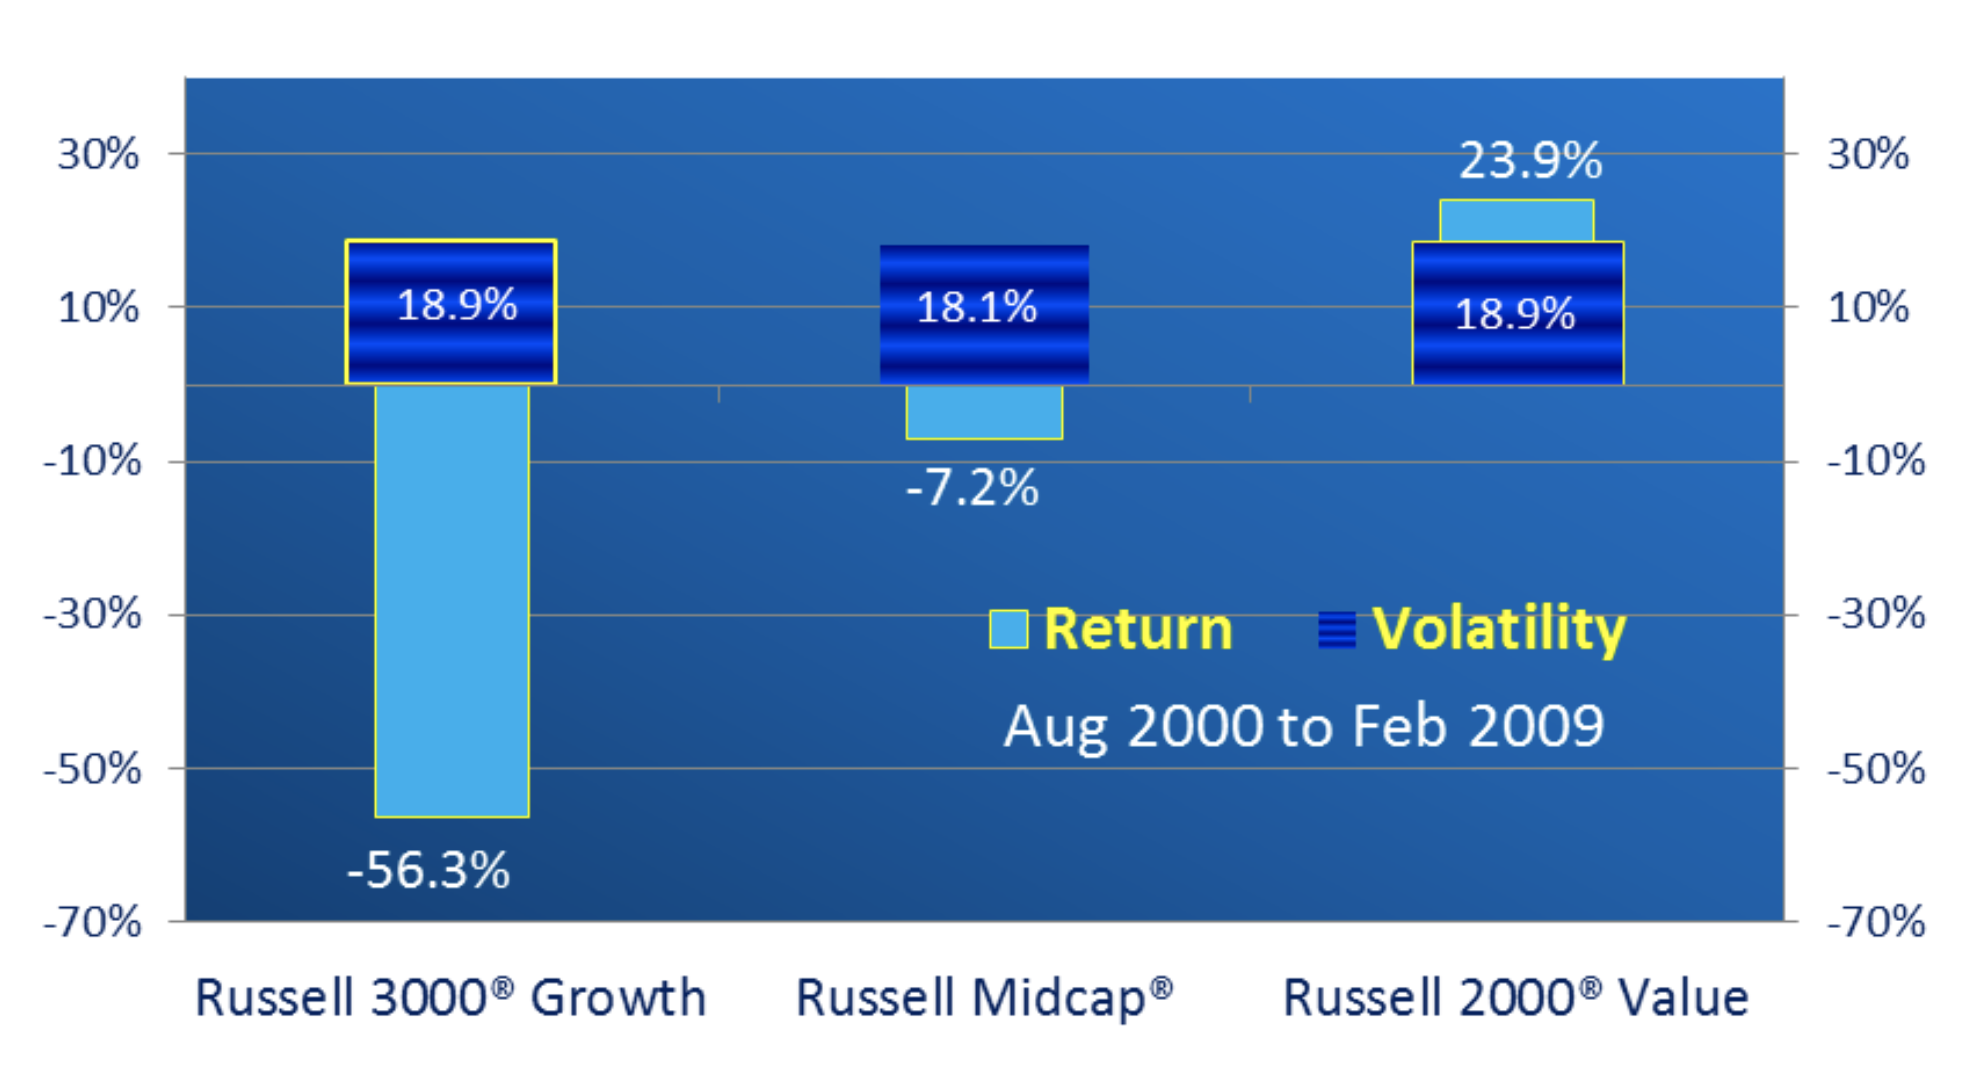
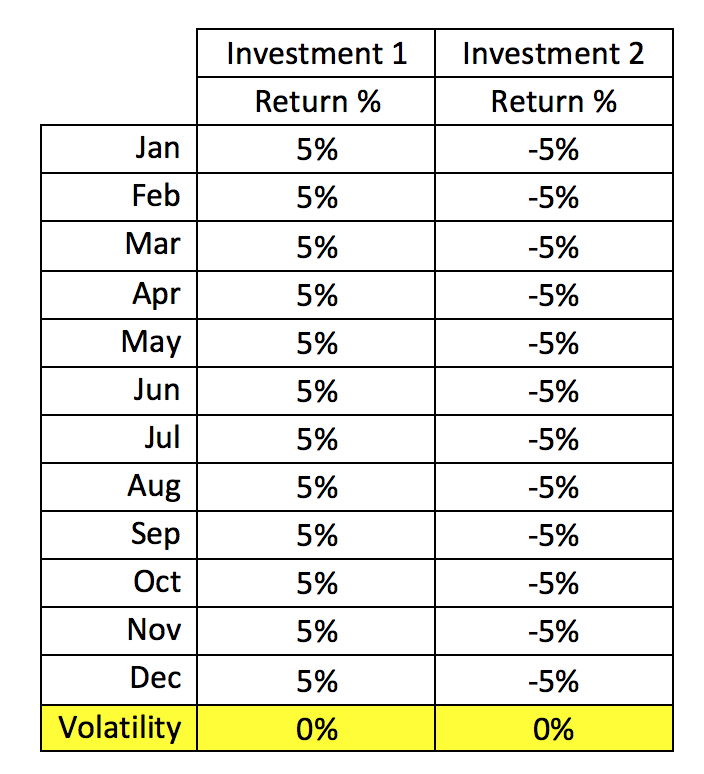
Real-world experience shows there is no established causal relationship between volatility and return.

Individual Stocks

It stands to reason. Pick out companies with strong and consistent revenue and earnings prospects and robust balance sheets. They report consistent earnings streams and profitability, and do not get into trouble due to capital inadequacy, non-conforming accounting policies and poor corporate governance.

In contrast, weaker companies by nature have less consistent profit streams and more vulnerable financials. Their stock prices would exhibit greater variability due to earnings disappointments punctuated by momentary euphoria.

Their periodic returns would be highly time-dependent and more volatile, perhaps suitable for short-term in-out trading, but not better than their stronger, more profitable brethren.

screen-shot-2016-10-18-at-5-10-25-am

Market Indices

On a broader perspective, the relationship between volatility and return exhibited by key market indices during the bear market of 2000-2009 was striking.

Russell Investments constructs and publishes a series of market indices. Their compositions of the component companies and the characteristics of those stocks are significantly different. The Box nearby shows the definitions of three indices, Russell 3000 Growth, Russell 2000 Value, and Russell Midcap. Growth 3000 measures the performance of the growth sector of the U.S. equity market. Value 2000 is a small cap value index. Russell Midcap consists of the mid-cap segment.

Fundamentally, the risks of these indices are clearly different. They emanate from the nature of small companies more vulnerable than their larger brethren to changes in business conditions; to value stocks that tend to sell at discounts to market; and growth stocks that sometimes reported disappointing earnings causing their stocks to tumble hard, hence often considered as higher-risk. After all, between August 2000 and February 2009, Russell 3000 Growth lost -56.3 percent.  The loss of Russell Midcap was more modest, -7.2 percent. However, Russell 2000 Value registered a gain of 23.9 percent. For reference, the DJIA lost -37.0 percent during the same period.

Yet, these three indices were shown to have the same volatility: 18.9 percent for both Growth and Value, and 18.1 percent for Midcap. The venerable all-inclusive MVO risk statistic showed these three indices to be equally risky. These histories were not anecdotal, but universal when standard deviation is applied to measure risks of different investments.

Screen Shot 2017-03-26 at 6.08.55 AM

Why?

This is because of the formulation of the statistic.
MVO measures risk by calculating the arithmetic or simple average rate of return for a time period, and the deviations of actual periodic returns from this average. Note that the deviations above the average (positive or actual returns are higher than the average) as well as those below the average (negative) are squared to the power of two; the negative deviations get transformed into positive values just as the positive deviations.

In other words, positive and negative deviations of the same amounts are treated as if they were equally acceptable.

Let’s take a look at the following table. It shows the monthly investment return of two investments A and B. A had a monthly gain of 5%, every month. B had a monthly loss of (5%), all 12 months.

Yet, they both have the same volatility, zero!

Volatility can NOT effectively differentiate the risks of bad from good investments.

screen-shot-2016-10-19-at-10-00-53-am